fitbitViz
The fitbitViz R package allows the extraction of data and the visualization of ‘ggplot2’, ‘Leaflet’ and 3-dimensionsal ‘Rayshader’ Maps using the Fitbit Web API. If you own any of the Fitbit activity trackers you can take advantage of this package. A detailed explanation of the functionality can be found both in the Vignette and in the blog post.
The 3-dimensional Rayshader Map requires the installation of the CopernicusDEM R package which includes the 30- and 90-meter elevation data.
Requirements:
To make use of this R package you have first to register an Application in https://dev.fitbit.com/. By registering an application you will receive the Fitbit token which besides your existing user-id is required so that you can take advantage of the fitbitViz functions.
There are many resources on the web on how to setup a Fitbit application. The Fitbit web API documenation includes more details. The next images and comments explain the whole process,
-
Go to https://dev.fitbit.com/ and click on Manage > Register an App
Login with your Fitbit credentials and follow the prompts. I used as URL in the Registration Page my Fitbit user-id url,
https://www.fitbit.com/user/USER_ID. You have to replace the USER_ID in the url with your specific user-id. Then in the Redirect URL field usehttps://localhost. Tick the remaining options as in the next image, read and agree to the terms of service and click Register to register the application.
-
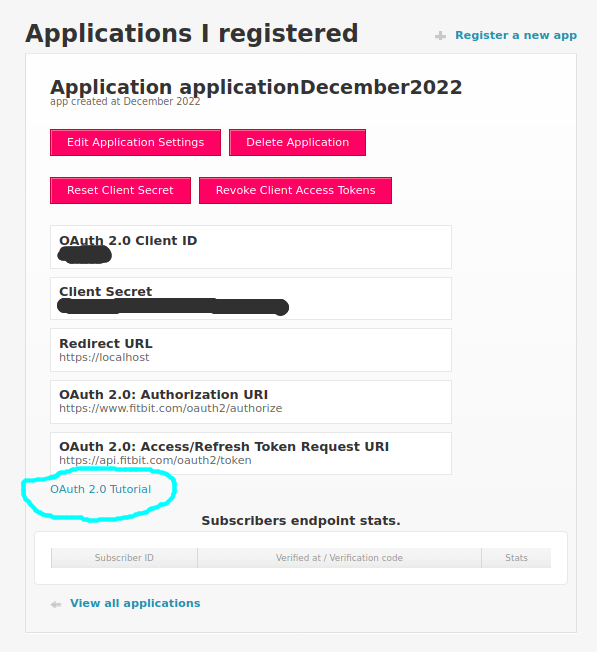
Once the app is created, click on the ‘OAuth 2.0 Tutorial’ weblink near the bottom of the screen:
-
In the ‘Fitbit OAuth 2.0 Tutorial’ website the Client ID already exists and we have to copy-paste the Client Secret from the previous web page

-
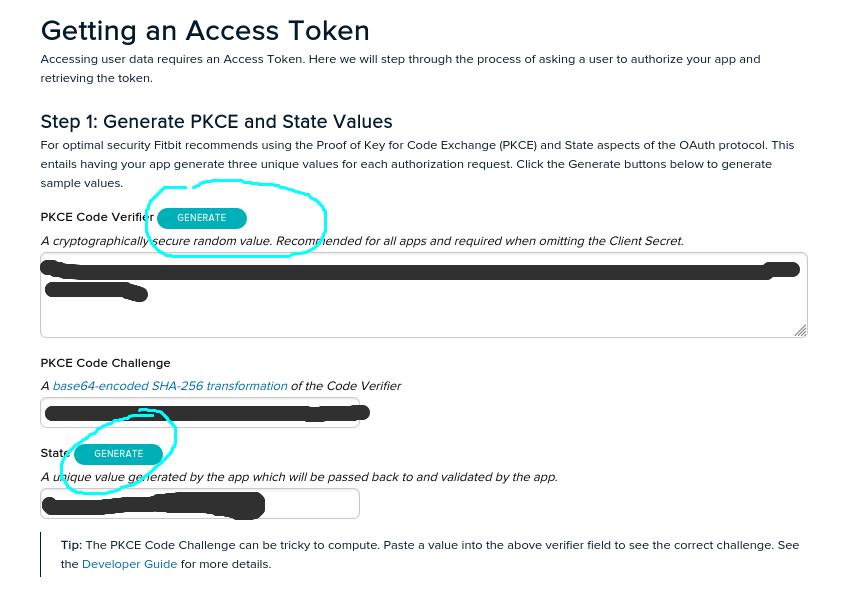
then we scroll down to the ‘Getting an Access Token’ section and click to the two “Generate” buttons to generate the required codes,
-
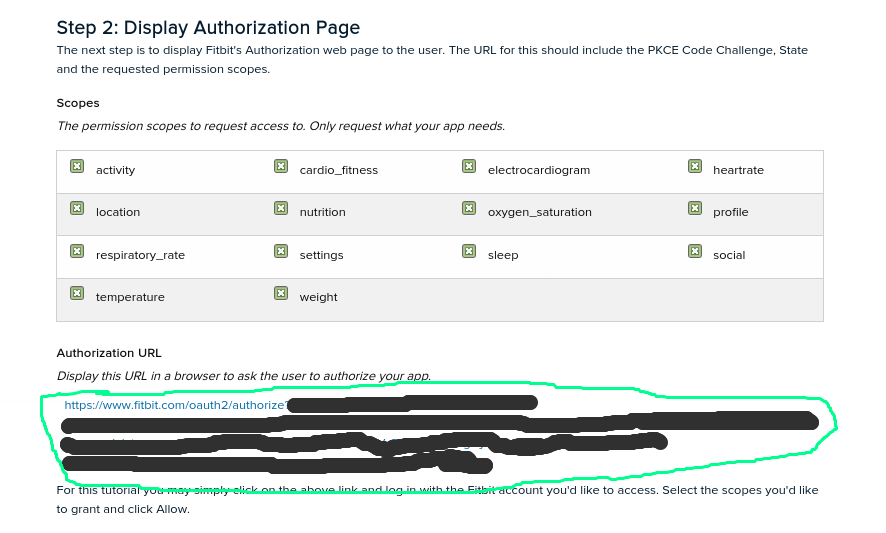
In the next section ‘Step 2: Display Authorization Page’ we click to the already created URL which will open a new tab to our web browser,
-
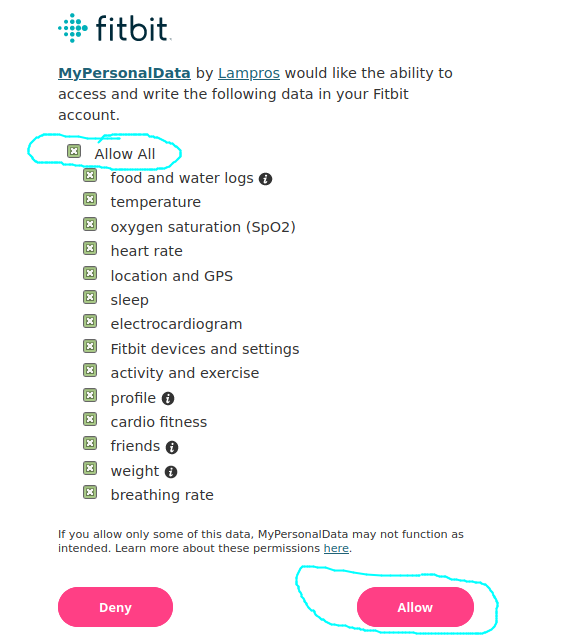
in this new web page tick the Allow All and click the Allow button
-
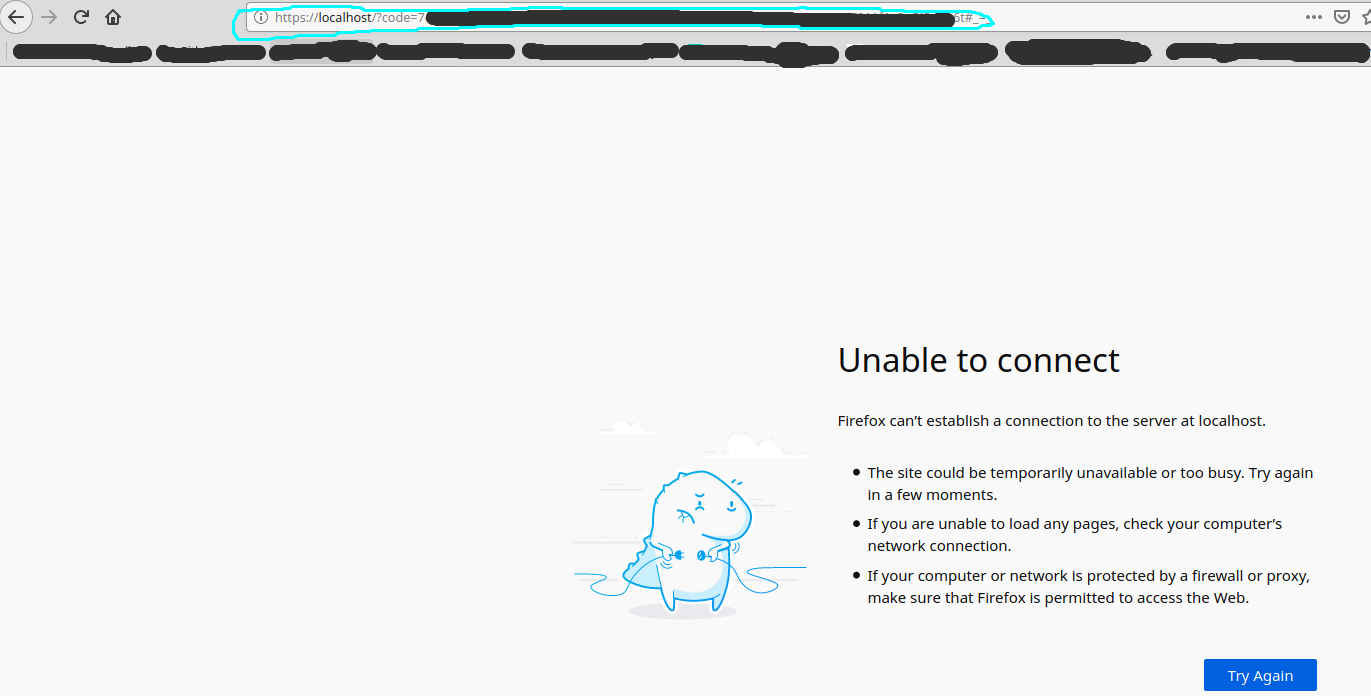
After clicking Allow, the browser tab redirects to the callback URL. Although this might seem like an “Unable to connect” web page the important thing here is to just copy the URL of the web page as follows,
-
and paste it to the section “Step 3: Handle the Redirect” where the “Authorization code” and “State” will be created,

-
finally in section “Step 4: Get Tokens” we just click to the SUBMIT REQUEST button to receive the token in the Response field,
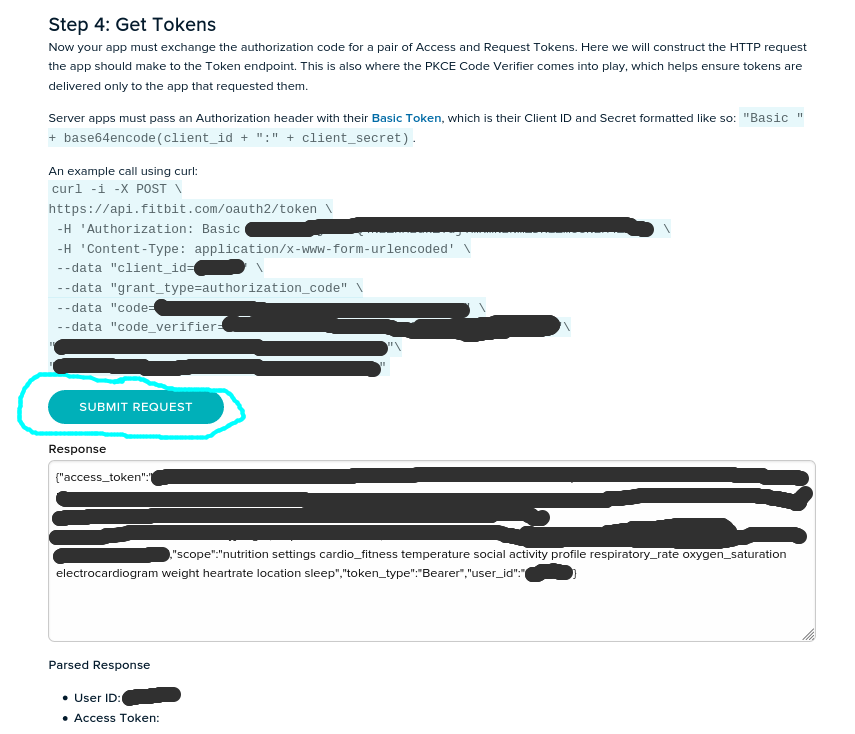
The parsed response looks as follows,

You now have your Access Token and can start using the fitbitViz R package to access and visualize your data. Keep in mind that the Access token is valid for 8 hours. Based on the documentation of the fitbit API
“After the Access Token expiration time has passed your requests will receive a 401 HTTP error. When this happens, your app should use the Refresh Token to get a new pair of tokens”.
To refresh the token the user of the fitbitViz R package can use the refresh_token_app() function, which requires the client id, client secret and refresh token of your registered Fitbit application, in the following way:
require(fitbitViz)

#..............................................
# Refresh token once it expires (after 8 hours)
#..............................................

client_id = 'xxxxxx'
client_secret = 'xxxxxxxxxxxxxxxxxx'
refresh_token = 'xxxxxxxxxxxxxxxxxxxxxxxx'

# refresh the token
new_token = refresh_token_app(client_id = client_id,
                              client_secret = client_secret,
                              refresh_token = refresh_token)

# a named list that includes the new 'access_token' and 'refresh_token'
str(new_token)
Keep track of your activities using ‘fitbitViz’, ‘Blogdown’ and ‘Github Actions’
UPDATE 26-12-2022: The registration of an Application of the fitbit web API has changed and it seems that users have to refresh the token every 8 hours. The following instructions were meant to be used with a registered application that wouldn’t require to refresh the token for 1 year.
The functions of the fitbitViz R package can be used in an automatic way so that the user can keep track of the Visualizations and data over time.
From the first moment I’ve started implementing the fitbitViz R package this is what I actually had in my mind. You can have a look to my Fitbit Visualizations website. The following steps explain in detail how this can be achieved:
- Fork the fitbitVizBlog repository ( !!! Not this repository but the one that includes the blog posts !!! )
- Create the following secrets required for the .github/workflows/gh_fitbit_blog.yaml file by navigating to Settings >> secrets (be aware that the AWS_ACCESS_KEY_ID and AWS_SECRET_ACCESS_KEY are optional and required only if you want to receive the 3-dimensional Rayshader Visualization)
- USER_ID: click on ‘New repository secret’ and use USER_ID as Name and your Fitbit user-id as Value
- FITBIT_TOKEN: click on ‘New repository secret’ and use FITBIT_TOKEN as Name and the token you received from your previously registered Fitbit application as Value
- GH_PAT: First create a Personal Access Token by giving as Note a name and then ticking in Select scopes the workflow (Update GitHub Action workflows) scope and lastly click on Generate Token. Then click on ‘New repository secret’ and use GH_PAT as Name and the copied Generated Token as Value
- EMAIL: click on ‘New repository secret’ and use EMAIL as Name and the e-mail you use on Github as Value
- AWS_ACCESS_KEY_ID: click on ‘New repository secret’ and use AWS_ACCESS_KEY_ID as Name and insert your aws access key id in the Value field ( the aws credentials are required for the Copernicus Elevation Data, this guide explains how to receive the aws credentials )
- AWS_SECRET_ACCESS_KEY: click on ‘New repository secret’ and use AWS_SECRET_ACCESS_KEY as Name and insert your aws secret access key in the Value field
What it remains is to modify the .github/workflows/gh_fitbit_blog.yaml file to adjust the
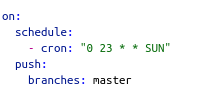
- current cron-job settings which runs every Sunday at 23:00 pm
- current fitbitViz parameters

Regarding the fitbitViz parameters (.github/workflows/gh_fitbit_blog.yaml file) at it’s current state the application takes:
- DATE: this parameter corresponds to the current Date ( the Date that the Cron-Job runs ). You can set this parameter also to a character string such as DATE=“2021-05-16”; if you want to use as the end Date this specific date. Be Aware this parameter is defined in a separate github action step.
- previous_n_days: this parameter specifies the number of days before the current DATE for which the Fitbit data will be downloaded (I’ve set it to 6 to visualize and access data of the last week)
- sleep_time_begins: this is your scheduled sleep time in form of a lubridate::hms(“00H 40M 0S”) object (adjust the input depending on your sleep time)
- sleep_time_ends: this is your scheduled wake up time in form of a lubridate::hms(“08H 00M 0S”) object (adjust the input depending on your wake up time)
-
asc_desc_linestring: this parameter is related to the GPS data of the 3-dimensional map especially if you keep track of your outdoor activities. There are 3 options but before making use of the 2nd. option make sure that there is an ascending and descending route, otherwise it will give an error:
- by specifying asc_desc_linestring=““; a single LINESTRING will be created based on the GPS data using a single color
- by specifying asc_desc_linestring=“TRUE”; the LINESTRING of the GPS data will be split into 2 parts using the highest elevation location as a split point (blue color for the ascending part and red color for the descending part)
- by specifying asc_desc_linestring=“17H 5M 0S”; the GPS data will be split into 2 parts using this input time as split point (adjust the time based on your data)
- time_zone: your current time zone as specified in lubridate::ymd_hms(tz = ..) function (it defaults to my current time zone which is Europe/Athens)
- buffer_meters: this parameter extends the 3-dimensional map by N-meters (the current default value is 1500 meters)
- resolution_dem: this parameter takes either 30 or 90 and corresponds to the resolution of the Copernicus elevation data (the current default value is 30 meters)
- verbose_Rmd: this last parameter is just for debugging in case you want to enable verbosity in the output .Rmd file (it defaults to “FALSE” and it takes also “TRUE” as input)
The order to modify, debug or include new code / functions to the files of this Github Repository is the following:
- first modify the gh_fitbit_blog.yaml file
- then modify the R code of the R_templates/data_template.R file
- and finally modify the Rmd code of the R_templates/functions_template.Rmd file
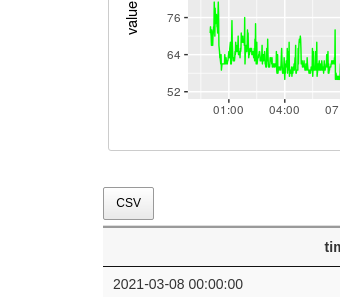
One important thing to keep in mind is that besides the Visualizations the user has access also to the pre-processed Fitbit data by clicking to a CSV button as shown in the next image,
- References:
Docker Image:
Docker images of the fitbitViz package are available to download from my dockerhub account. The images come with Rstudio and the R-development version (latest) installed. The whole process was tested on Ubuntu 18.04. To pull & run the image do the following,
docker pull mlampros/fitbitviz:rstudiodev

docker run -d --name rstudio_dev -e USER=rstudio -e PASSWORD=give_here_your_password --rm -p 8787:8787 mlampros/fitbitviz:rstudiodev
The user can also bind a home directory / folder to the image to use its files by specifying the -v command,
docker run -d --name rstudio_dev -e USER=rstudio -e PASSWORD=give_here_your_password --rm -p 8787:8787 -v /home/YOUR_DIR:/home/rstudio/YOUR_DIR mlampros/fitbitviz:rstudiodevIn the latter case you might have first give permission privileges for write access to YOUR_DIR directory (not necessarily) using,
chmod -R 777 /home/YOUR_DIRThe USER defaults to rstudio but you have to give your PASSWORD of preference (see www.rocker-project.org for more information).
Open your web-browser and depending where the docker image was build / run give,
1st. Option on your personal computer,
http://0.0.0.0:8787 2nd. Option on a cloud instance,
http://Public DNS:8787to access the Rstudio console in order to give your username and password.
Package Installation & Citation:
To install the package from CRAN use,
install.packages("fitbitViz")and to download the latest version of the package from Github,
remotes::install_github('mlampros/fitbitViz')If you use the fitbitViz R package in your paper or research please cite https://CRAN.R-project.org/package=fitbitViz:
@Manual{,
  title = {{fitbitViz}: Fitbit Visualizations},
  author = {Lampros Mouselimis},
  year = {2022},
  note = {R package version 1.0.5},
  url = {https://CRAN.R-project.org/package=fitbitViz},
}

