
Statoil / C-CORE Iceberg Classifier Competition
01 Feb 2018For the last two months, I had participated in a machine learning competition organized by Kaggle (platform for predictive modeling and analytics), where I ended up in the top 1 % on the private leaderboard or 24th out of 3343 participants. I thought it would be worth writing a blog post in order to both share my experience / insights and keep a reference of key features for satellite imagery ( Sentinel-1 satellite data and specifically HH - transmit/receive horizontally - and HV - transmit horizontally and receive vertically ) in case it might be useful in the future.
The data
The aim of the competition was to predict whether an image (dimensions of 75 x 75) contains a ship or an iceberg. The data were presented in json format, with the following fields: id (the id of the image), band_1 and band_2 (preprocessed image data), inc_angle (the incidence angle of which the image was taken), is_iceberg (the target variable, set to 1 if it is an iceberg, and 0 if it is a ship). More details on the competition and specifically on the satellite imagery used can be found in the following two web links, here and here.
Programming languages
I used Python and mainly the Keras deep learning library (with Theano backend) for the machine learning models and R to process the output predictions.
Machine learning models
The data set was small to moderate in size with 1604 train and 8424 test images (4999 images of the test set were machine generated to discourage hand labeling), so one could experiment with many deep learning configurations (pre-trained too). I started with the following configuration (appeared in one of the kernels),
model = Sequential()
model.add(Conv2D(32, kernel_size=(3,3), activation='relu', input_shape=(75, 75, 3)))
model.add(MaxPooling2D(pool_size=(2, 2)))
model.add(Dropout(0.25))
model.add(Conv2D(64, (3,3), activation='relu'))
model.add(MaxPooling2D(pool_size=(2, 2)))
model.add(Dropout(0.25))
model.add(Conv2D(128, (3,3), activation='relu'))
model.add(MaxPooling2D(pool_size=(2, 2)))
model.add(Dropout(0.25))
model.add(Conv2D(128, (3,3), activation='relu'))
model.add(MaxPooling2D(pool_size=(2, 2)))
model.add(Dropout(0.25))
model.add(Flatten())
model.add(Dense(256, activation='relu'))
model.add(Dropout(0.3))
model.add(Dense(256, activation='relu'))
model.add(Dropout(0.3))
model.add(Dense(1, activation='sigmoid'))

model.compile(loss='binary_crossentropy', optimizer='Adam', metrics=['accuracy'])
and it was one of those that I kept until the end of the competition (with small modifications which I’ll explain later) as it contributed significantly to the final ensemble.
Additionally, I took advantage of some of the keras applications such as VGG16, VGG19, InceptionV3 or Resnet50. Although the pre-trained applications gave good results both locally and in the leaderboard, it took a certain amount of time to run those on my personal desktop (some of them almost a day using cross-validation), so in the last few weeks I decided to search for simple configurations (utilizing hyperopt), which finally gave similar results as the pre-trained ones, but were more time efficient.
data processing which improved the log-loss
image channel size
The image channel size was a parameter that one had to adjust during the competition. The initial data came by default as two-channel images (dual-polarization - HH and HV), so participants had to either train the machine learning models with the data as is or to modify them. I decided to use besides the dual-band also the average of the two, firstly because I intended to use pre-trained applications (such as VGG) and secondly because I observed that the channel size didn’t make a difference in the public leaderboard. The following code chunk shows how I continued with the images,
# assuming the INPUT_FILE is the 'train.json'
#--------------------------------------------

DATA = pd.read_json(INPUT_FILE)

X = DATA.iloc[:, 0:2].values


bd1 = [X[i][0] for i in range(len(X))]                                       # first dual-polarization-band

bd2 = [X[i][1] for i in range(len(X))]                                       # second dual-polarization-band


bd1 = np.array([np.array(band).astype(np.float32).reshape(75, 75) for band in bd1])

bd2 = np.array([np.array(band).astype(np.float32).reshape(75, 75) for band in bd2])

bd3 = ((bd1 + bd2) / 2.0)


imgs = np.concatenate([bd1[:, :, :, np.newaxis], bd2[:, :, :, np.newaxis], bd3[:, :, :, np.newaxis]], axis=-1)     # images to use
Many of the competition kernels used the previous pre-processing step before inputting the data to a deep learning model.
normalization of Decibels
A good thing to do before training a deep learning model is to scale and/or center the data. The images of this competition were already pre-processed and the values of each band were in db (Decibel). However, the data wasn’t in the range between 0 and 1. I came across a similar question on the web and the following function, which normalizes Decibel values in the range between 0 and 1, improved the log-loss in all my deep learning models,
# assuming 'DATA' is a pandas data frame
#---------------------------------------

def db_normalize(DATA):

    a = [np.exp(i / float(20)) for i in DATA['band_1']]

    b = [np.exp(i / float(20)) for i in DATA['band_2']]

    return pd.Series(dict(band_1=a, band_2=b))
zca whiten of images
Zca whitening is a suggested pre-processing step in the computer vision literature and it was also recommended from participants in this competition. I already had incorporated a similar function in my OpenImageR package. However in this competition I used Python so I utilized a small Cython wrapper to include the Zca whiten C++ code in my pre-processing pipeline. I performed Zca whitening before the fit-process and I didn’t use the zca-whiten function of the image generator of the keras library mainly because I wasn’t sure if artificially increasing the data size would lead to better results.
In general, Zca whitening also proved to be useful for the dual polarization images.
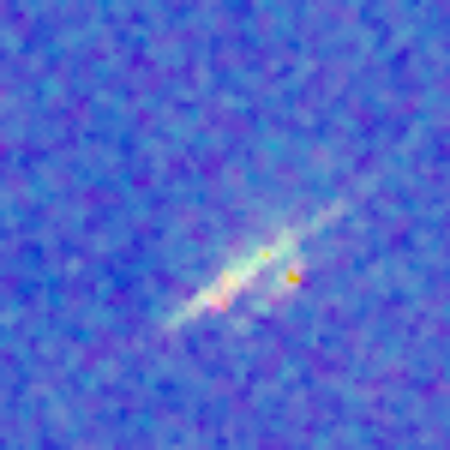
AveragePooling2D and image despeckling
Dual polarization images, when plotted, seem to include simple noise. However, “unlike optical remote sensing images, characterized by very neat and uniform features, SAR images are affected by speckle. Speckle confers to SAR images a granular aspect with random spatial variations” (reference link).
In this challenge, one of my thoughts was, how to remove the speckle from the images so that the algorithm can improve the classification of ships and icebergs. There are already despeckling technics (such as the Boxcar or the Lee filters) which appear to have an effect on dual polarization images. One of the participants in the competition wrote also a detailed kernel on image despeckling using the Lee filtering in Python.
Although, I didn’t attempt to pre-process the images using one of the despeckling filters, what it helped for this particular task (and data set) was the average pooling layer of a convolutional neural network. During the competition, I’ve performed (as always) a search on the web to find information on how to improve the evaluation metric (log-loss) and I came across a thesis, which was about “Convolutional Neural Networks for contextual denoising and classification of SAR images”. The author, besides the despeckling technics, also showed the results for max-pooling and average-pooling (page 58 of the previous web link), which kind of was a hint for a non-expert in image despeckling like me.
In general, for the same deep learning configuration, the switch from max-pooling to average-pooling decreased the log-loss for this particular data set.
Data leakage (incidence angle)
Data leakage can appear from time to time in Kaggle competitions and it’s obvious especially if the gap between some of the top 10 kagglers and the rest of the participants, in terms of leaderboard score, is kind of big. In my opinion, data leakage does not offer any benefits both to the organizers and to participants, because it’s a temporary feature, that can’t be incorporated to a long-term predictive model (as far as I can tell). I’m generally unlucky with data leaks, however, in this one, it appeared as a kernel and it was accessible by all participants. After I observed the previously said gap (I think a few weeks before the end of the competition), I kind of was looking for a way to take advantage of the incidence angle to improve the leaderboard score without harming the generalization of the already trained deep learning models.
I used the data leak in the following way,
- first I created a file of the true images (not the machine-generated ones)
- then I merged the train images with the true test images using the incidence angle as merge ID
- then for the subset of test data that the incidence angle matched with the incidence angle of the train data I took either the 1st quartile (if the true label was 0) or the 3rd quartile (if the true label was 1). I decided to take the 1st and 3rd quartiles so that in case of false positives / negatives the increase of log-loss would not harm the score considerably.
Although I had my doubts in picking a submission, which included the incidence angle “manipulation”, finally in the private leaderboard this submission gave a pretty similar log-loss, whereas for my second selected submission I experienced a big discrepancy (ensemble of multiple seeded models). I guess the data leak worked as a stability factor for the same output predictions, as indeed dual polarization images in both train and test data, which shared the same incidence angle, had also the same label.
My final submission included different deep learning configurations, both simple and pre-trained. So, in total 4 deep learning models, where each model consisted of an average of 3 (using a different seed each time). The running time of all these deep learning models, on a recent GPU, might take more than a week.
Things I tried which didn’t work
-
I experimented also with autoencoders as a pre-processing step having in mind to remove the speckle of the images. Although it worked it didn’t give good scores ( a similar kernel ).
-
I also tried to replace the missing values of the incidence angle,
- using a convolutional neural network with the incidence angle as a response variable. I used the non-missing values as train data and the missing values as test data.
- with 0.
- However, in both cases, I saw a big difference between local (cross-validation) and leaderboard score, so I included the incidence angle in one of my 4 selected models as an additional feature besides the dual polarization bands.
final word
Every time I participate in an online challenge it’s kind of a learning experience for me because I learn things that I wasn’t aware before, as was the case with the dual polarization images in this competition. I’ve also refreshed my knowledge in deep learning and in coding as well.
I included a single R file in my github repository with the data leak processing step (incidence angle). I’m certain that by applying it to any kernel in the competition web site, it should give a descent leaderboard score.